Texas DOT’s Own Numbers Cast Doubt on Its Story of Ever-Rising Traffic

Back in 2015, the people of Texas were asked by the legislature and Governor Greg Abbott to meet the challenge of the state’s projected traffic growth by enacting a constitutional amendment to require road spending for the next decade. The people agreed and voted to allocate about $38 billion in state taxes for the Texas Department of Transportation (TXDOT) — guided by the Texas Transportation Commission (TTC) — to build and maintain roads.
But what if the story about Texas growth that’s been drilled into the collective awareness by road builders is not quite accurate? What if there’s a major shift in urban areas toward driving a lot less?
The story that we’ve been told is that Texas is growing at a tremendous rate, with our urban and suburban counties essentially spiraling out of control with no end to traffic in sight. That’s the justification for throwing many billions of dollars at paving new roads. Looking at TXDOT’s District and County Statistics data (DISCOS), you can see the amazing amount of driving Texans do every day — county by county and metro area by metro area.
We drive a lot.
But the key question is not how much we drive — it’s whether the amount we drive is increasing. I was curious how driving levels have changed over time, so I asked TXDOT for historical DISCOS data, which aren’t readily available online. I was curious whether a look back at ten years of DISCOS data might change the story.
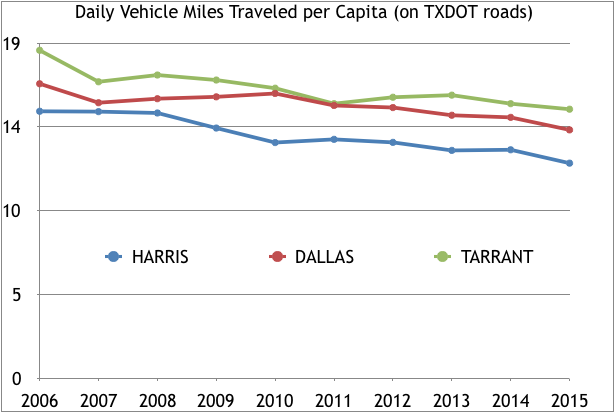
It turns out that TXDOT’s data show a reduction in traffic from 2006 to 2015 in Harris, Dallas, and Tarrant Counties — the three most populated counties in Texas. If this is an accurate characterization of travel patterns, the story that Texas tells itself about traffic needs to be revised.
While Harris County added about 682,228 people between 2006 and 2015, total traffic in 2015 was 2,991,492 fewer miles than in 2006, according to TXDOT data. Dallas County added 199,985 people, but saw 3,326,231 fewer daily traffic miles, and Tarrant County added 319,598 people and saw 667,317 fewer miles.
Adjusting for population, that means the average person in the three most populous counties in Texas — home to a full third of the state’s population of Texas — drives about three miles a day LESS than ten years ago. (The per capita decline in Harris, Dallas, and Tarrant counties was 2.93, 2.61, and 3.33 miles per day, according to TXDOT data.)
This is a very different story than the one told to the people of Texas when they were asked to require billions in annual road spending less than a year ago.
There are some key caveats to understand when looking at this data. The TXDOT DISCOS traffic data only includes estimates of the amount people are driving on TXDOT “on system” roads and highways. In general, we do not know from the TXDOT DISCOS data how much more or less Texans are driving on city and county roads, or on toll roads not under TXDOT’s control.
In fact, major players in Texas transportation policy don’t put much stock in the DISCOS data as a reflection of what’s happening in the region. They don’t seem to believe it is possible that travel behavior in the most populous counties in Texas may have changed after decades of adding more compact development.
We’ll look at why that might be, and what the implications are, in part two. Stay tuned.
This post is made possible by a grant from Sutliff & Stout, an accident and injury law firm in Houston Texas. The content is Streetsblog’s own, and Sutliff & Stout neither endorses nor exercises any editorial control.


